Data analysts work with datasets from various sources and in different formats. Sometimes the dataset has to be retrieved from a database in a .csv format; and sometimes the dataset may be collated and sent in a .xlsx file. Once in a while, the dataset has to be retrieved from a 3rd-party web application. This is usually in form of an API and may be retrieved in a JSON file.
APIs, or Application Programming Interface, is a software interface that allows computers to communicate with each other. They define what kind of requests and responses can be sent and received between two applications. When a data analyst has to make a request for a dataset via an API connection, the response to this request is usually received in a JSON format. JSON, or JavaScript Object Notation, is a type of lightweight data format, not dissimilar to a .csv file.
Of course, working with APIs and JSONs will require some knowledge of how to make these requests and how to parse the JSON response for analysis. Thankfully, there are several popular APIs lying around on the internet, such as Spotify’s API, Twitter API and Google Maps API. Playing with these APIs and testing how to make requests over different connections builds familiarity with how to make these connections and work with the response files.
An interesting project would be to build a script that requests data via an API and uses the data received to create a function based on analytics from the data. We’ll use data received from the different APIs of Homebrew’s packages which contains analytics of the number of installs over the last 30, 90 and 365 days.
Project
Homebrew is a software package manager for installing software on Macs and Linux. On the Homebrew website, each software package has a JSON API which provides data on installation, build error, and operating system version statistics from the last 30, 90, and 365 days. Use the analytics received from the Homebrew API to sort the software packages (using a custom key) and find out the most installed packages.
Solution
First, a look at the Homebrew website to see how the packages are listed.
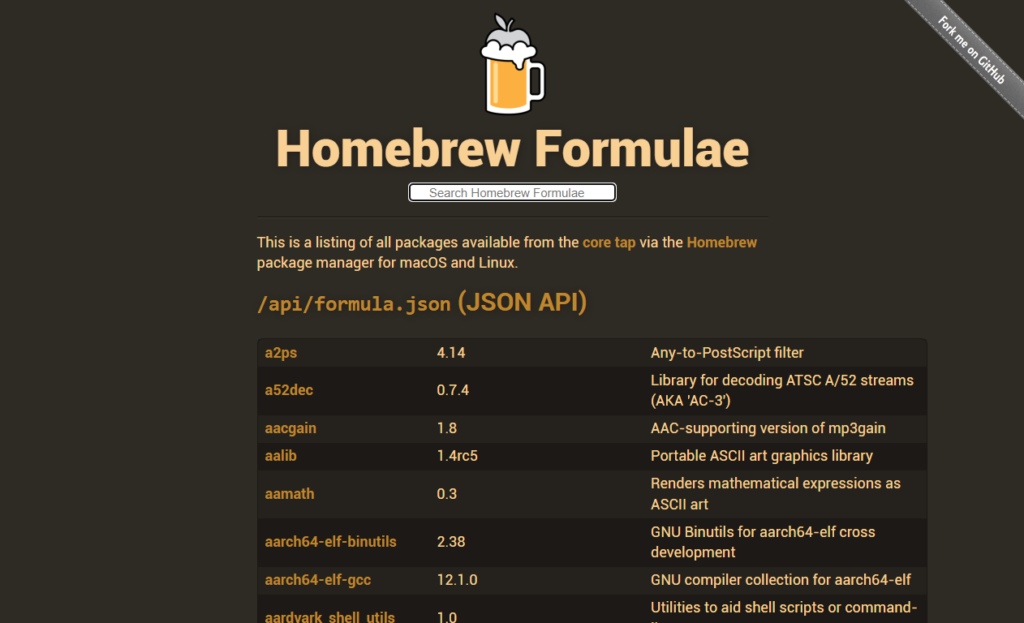
The Homebrew Formulae page contains the name of all the packages available for installation. However, the JSON API received from this page doesn’t contain the analytics for each of the software packages. To find that, we need a way to send a request to the formula JSON APIs of the individual packages listed and parse through the analytics data received.
Before writing the script, it would help to begin by writing the pseudo-code, breaking down the steps needed to accomplish this task.
- Starting with the Formulae Core API, write a script that collects the names of the packages available and stores the names into a list.
- Write a script that sends a request to the JSON APIs of the packages in your list.
- Parse through the responses to the request sent.
- Add each package into a dictionary of key::value pairs containing the analytics we need.
- Append each dictionary entry into a list.
- Create a function for sorting through the dictionary entries based on a custom function.
For this project, we’ll need the requests library for sending requests to the API, and the JSON library to parse through the JSON response packages.
1. Script that collects the names of the packages: First let’s make a GET request to the Homebrew core using the requests library and parse through the response. We’ll name our JSON response as packages_json.
import requests
import json

base_url = 'https://formulae.brew.sh/api/formula.json'

r = requests.get(base_url)
packages_json = r.json()
We can take a look at one of the responses using the dumps method from the JSON library.
packages = json.dumps(packages_json[0]['name'], indent=2)Here is the response;
While the JSON response doesn’t contain analytics about the number of installs of each package, it contains the names of the packages, in the [‘name‘] key. To get the analytics about the number of installs, we need to send a request to the JONS APIs of each of the individual packages.
How do we create a list containing URLs for the JSON APIs of all the individual packages?
One way to do this is to parse out the URL from the Formula JSON package we received. Alternatively, we can parse out the names of all the packages available into a list, and loop through that list of names to create a custom API URL for each individual package.
Let’s go with the second option. For that, we’ll use list comprehension to parse out the names from our packages_json and save the list into a variable called names. We can also check the number of names in the list using the len function.
package_names = [package['name'] for package in packages_json]
print(len(package_names))
2. A script that sends a request to the JSON API of every package: With a project like this, containing X number of packages, it would be interesting to monitor how long it takes for this script to run completely. Let’s also import the time module and begin our timer at the start of the for loop.
t1 = time.perf_counter()Taking a look at the URL for one of the individual packages, we notice that all the URLs are written in the same format.
https://formulae.brew.sh/api/formula/{package-name}.json
We have our list of names and we have the URL template that all the package APIs use. With a for loop, we can use an f-string to insert our name variable into the URL template and send a request to our custom URL.
for package in package_names:
    package_url = f'https://formulae.brew.sh/api/formula/{package}.json'
    r = requests.get(package_url)
3. Parse through the responses: While still within our for loop, we can parse through the response to each request. This response contains the analytics we are looking for. In the [‘analytics‘] key, the values returned contain the number of installs for 30, 90 and 365 days.
We extract the install analytics from the JSON response and store them into separate variables. It will also be interesting to parse out the details about each package using the [‘desc‘] key.
package_json = r.json()

    full_name = package_json['full_name']
    desc = package_json['desc']
    installs_30d = package_json['analytics']['install']['30d'][package]
    installs_90d = package_json['analytics']['install']['90d'][package]
    installs_365d = package_json['analytics']['install']['365d'][package]
4. Store it in a python dictionary: With the name, description and install analytics values extracted, we can proceed to save these values in a key::value pair for each package in the loop.
 package_analytics = {
        'full_name': full_name,
        'desc': desc,
        '30d': installs_30d,
        '90d': installs_90d,
        '365d': installs_365d,
    }
5. Append each dictionary package into a list: All done with the process of parsing the response! All that’s left is to append every dictionary package into an empty analytics list. The requests library also contains an elapsed attribute which provides the timedelta between sending a request and receiving the response. Let’s monitor the time it takes between sending the request and receiving the response for each package in our for loop. To avoid overloading the server with our multiple requests, it will be considerate to add a sleep method from the time library to suspend execution of each iteration for a certain number of seconds (once again, let’s use the timedelta between sending a request and receiving a response).
analytics.append(package_analytics)
    print(f"Operation completed in {r.elapsed.total_seconds()} seconds")
    time.sleep(r.elapsed.total_seconds())

t2 = time.perf_counter()
6. Create a function for sorting through the dictionary entries based on a key: With our analytics list containing analytics of every software package from Homebrew, we can run different types of EDA (exploratory data analysis) on the list. For example, we might be interested in finding out the top 10 most installed packages in the past 30, 90 or 365 days. We may be interested in filtering packages which contain a keyword in their description, such as ‘video’. All of these things can be done. Let’s try out sorting out the packages by number of installs in descending order (from highest to lowest). For that, we use python’s sorted function. The sorted function requires an iterable (our analytics list) and a key to use for sorting the list. For the key, we can either use a lambda function or create a custom function. While lambda functions may be more convenient, let’s create custom functions for sorting by 30, 90 and 365 days installs respectively.
def sort_by_30d(x):
    return x['30d']


def sort_by_90d(x):
    return x['90d']


def sort_by_365d(x):
    return x['365d']
With our custom functions now created, we are ready to use the sorted function on our analytics list. Unlike python’s sort method which modifies the original list, the sorted function returns a new list object without modifying the original list. Bearing this in mind, we can use the sorted function to return 3 different and separate lists without modifying the order of our original analytics list. We also set ‘reverse=True‘ to sort in descending order.
analytics_30d = sorted(analytics, key=sort_by_30d, reverse=True)
analytics_90d = sorted(analytics, key=sort_by_90d, reverse=True)
analytics_365d = sorted(analytics, key=sort_by_365d, reverse=True)